Linguistics maps: Where does your dialect fit in?

Have you ever gone on a vacation to another region of the country and it seems like the people are speaking a foreign language?
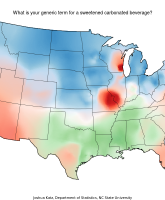
Say you go into a restaurant and want a Sprite. If you’re from the South, you’ll likely still say you want a coke and wait for the server to clarify. But, if you’re ordering from a place up north, you might be disappointed to receive the classic brown fizzy drink instead of what you really intended.
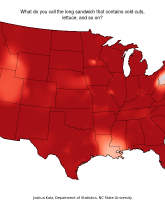
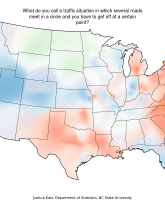
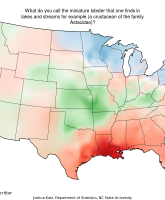
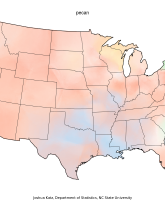
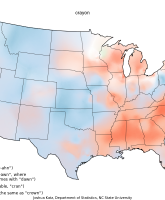
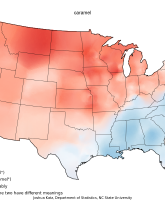
Those kinds of regional dialect differences interested Joshua Katz, a PhD student at North Carolina State University. Using linguistics data from Dr. Bert Vaux of Cambridge University, Katz mapped how the way we pronounce words varies throughout the country.
“Dr. Vaux’s maps showed each response as a single color-coded point, so you could see individual instances of each answer,” said Katz in an interview with The Abstract, the NC State student newspaper. “I wondered if there was a way to take the existing data and create maps that gave a more complete picture of national dialect differences.”
Using a statistical algorithm, Katz created 120 color-coded maps. The darker the color, the stronger the consensus. Here’s a sampling of his findings — just click on each picture to enlarge.


Although some of the verbal differences may lead to confusion, Katz believes they also enrich the country.
“I’ve always found variations in dialect fascinating – language says so much about who a person is,” Katz says. “To me, dialect is a badge of pride – it’s something that says, ‘This is who I am; this is where I come from.’”